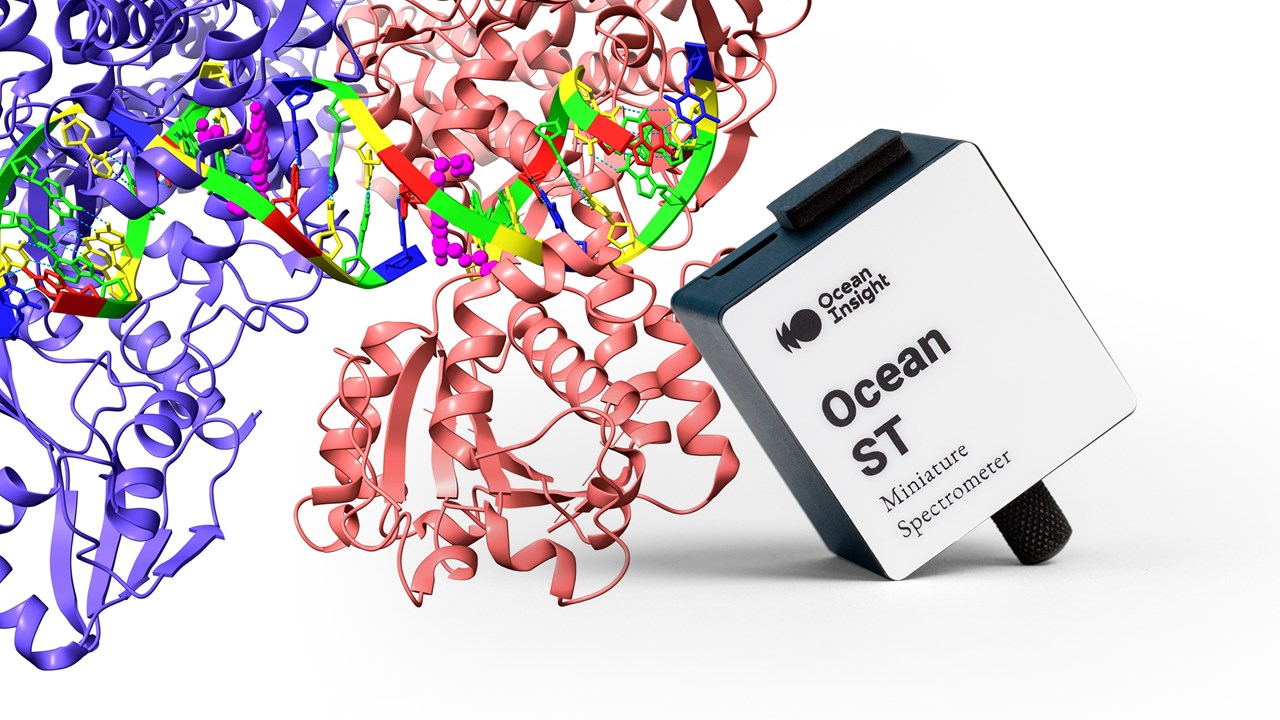
High-performance absorbance linearity in spectrometers has been limited to complex and expensive instruments. Now, simpler and more accessible spectrometers like Ocean ST are achieving comparable measurement results.
Ocean optics evaluated the absorbance linearity of the Ocean ST microspectrometer for protein and DNA measurements. Ocean ST is a spectrometer distinguished by its excellent UV response (185-650 nm), high signal to noise ratio performance, and ultra-compact footprint (smaller than a smartphone).
Note: Dr. Yvette Mattley provided the measurements for this application note.
Why absorbance?
Absorbance measurements provide valuable information about the chemical composition of materials. Light incident on a sample can be transmitted, absorbed or scattered. Transmission is the light that passes through the sample; light that encounters a molecule can be absorbed or scattered. Absorbance can be used as a qualitative tool to identify substances or as a quantitative tool to measure the concentration of a molecule in solution.
Absorbance is an important technique across a range of applications, especially in biomedical and life sciences, where researchers, developers and process engineers apply absorbance techniques to challenges from protein analysis to point of care diagnostics.
Absorbance Linearity
One indicator of a spectrometer’s measurement accuracy is its absorbance linearity. This is described in Beer’s Law, where a solution that absorbs light at a given wavelength will yield an absorbance peak at that wavelength, with its intensity varying linearly as the solution concentration changes. For example, if the solution concentration is doubled, the height of the absorbance peak also will double. So, when we describe a spectrometer as having absorbance linearity to 2 AU (absorbance units), this indicates that above 2 AU, the relationship between sample concentration and absorbance peak breaks down (is no longer linear). This breakdown relates to limiting factors including detector noise and stray light.
A spectrometer with high absorbance linearity allows users to 1) accurately measure samples over a wide range of concentration levels and 2) eliminate the need for highly involved sample dilution steps that run the risk of introducing errors into the measurement process. This can be critical for applications where very high measurement accuracy is desired, where you want to compare results from one experiment to the next, or where you have a limited amount of sample to work with.
Absorbance of Proteins and DNA using Ocean ST
To evaluate the absorbance linearity of the Ocean ST, we measured bovine serum albumin (BSA) and DNA oligo. BSA is a protein commonly used in biochemical applications and oligos are synthetic DNA or RNA common to myriad applications including genetic testing and medical diagnostics.
Equipment Setup
We used an Ocean ST-UV (185-650 nm) with the integration time set for 3.8 ms, scans to average at 100, and boxcar width set to 3. The dark spectrum was stored and nonlinearity correction enabled. The spectrometer and light source were warmed up for 30 minutes prior to measurements, to ensure thermal stability.
Here’s the rest of the setup:
- DH-2000-S-DUV-TTL deep-UV deuterium and tungsten halogen light source. For these experiments, we used the deuterium lamp only. The halogen lamp was off for all measurements.
- SQ1-ALL cuvette holder. This is a general-purpose cuvette holder for 1 cm cuvettes.
- CV-Q-10 1 cm (10 mm) pathlength quartz cuvette. Quartz cuvettes are the best option for UV measurements.
- QP450-1-XSR extreme solarization resistant optical fibers (quantity 2). These are 450 µm SR fibers with stainless steel BX jacketing.
Sample Preparation and Measurements
We measured 30 BSA (Sigma A2153) concentrations ranging from 0.02 to 5 mg/mL and 35 oligo DNA (Sigma D-3159) concentrations ranging from 0.3 to 150 µg/mL. All dilutions were done directly in the quartz cuvette by removing 0.5 mL sample from the cuvette, adding 0.5 mL distilled water to the cuvette, and then mixing the sample by gently pipetting the sample in and out of the tip 3 times. The quartz cuvette was not removed from the cuvette holder during the measurements, helping to minimize potential errors from contaminants or from issues with proper cuvette alignment.
Results
Absorbance measurements of BSA showed absorbance linearity to 2 AU, exceeding our expectations for the Ocean ST (Figure 1). This has very positive implications, as BSA is a typical protein with applications across many areas of life sciences research and development.
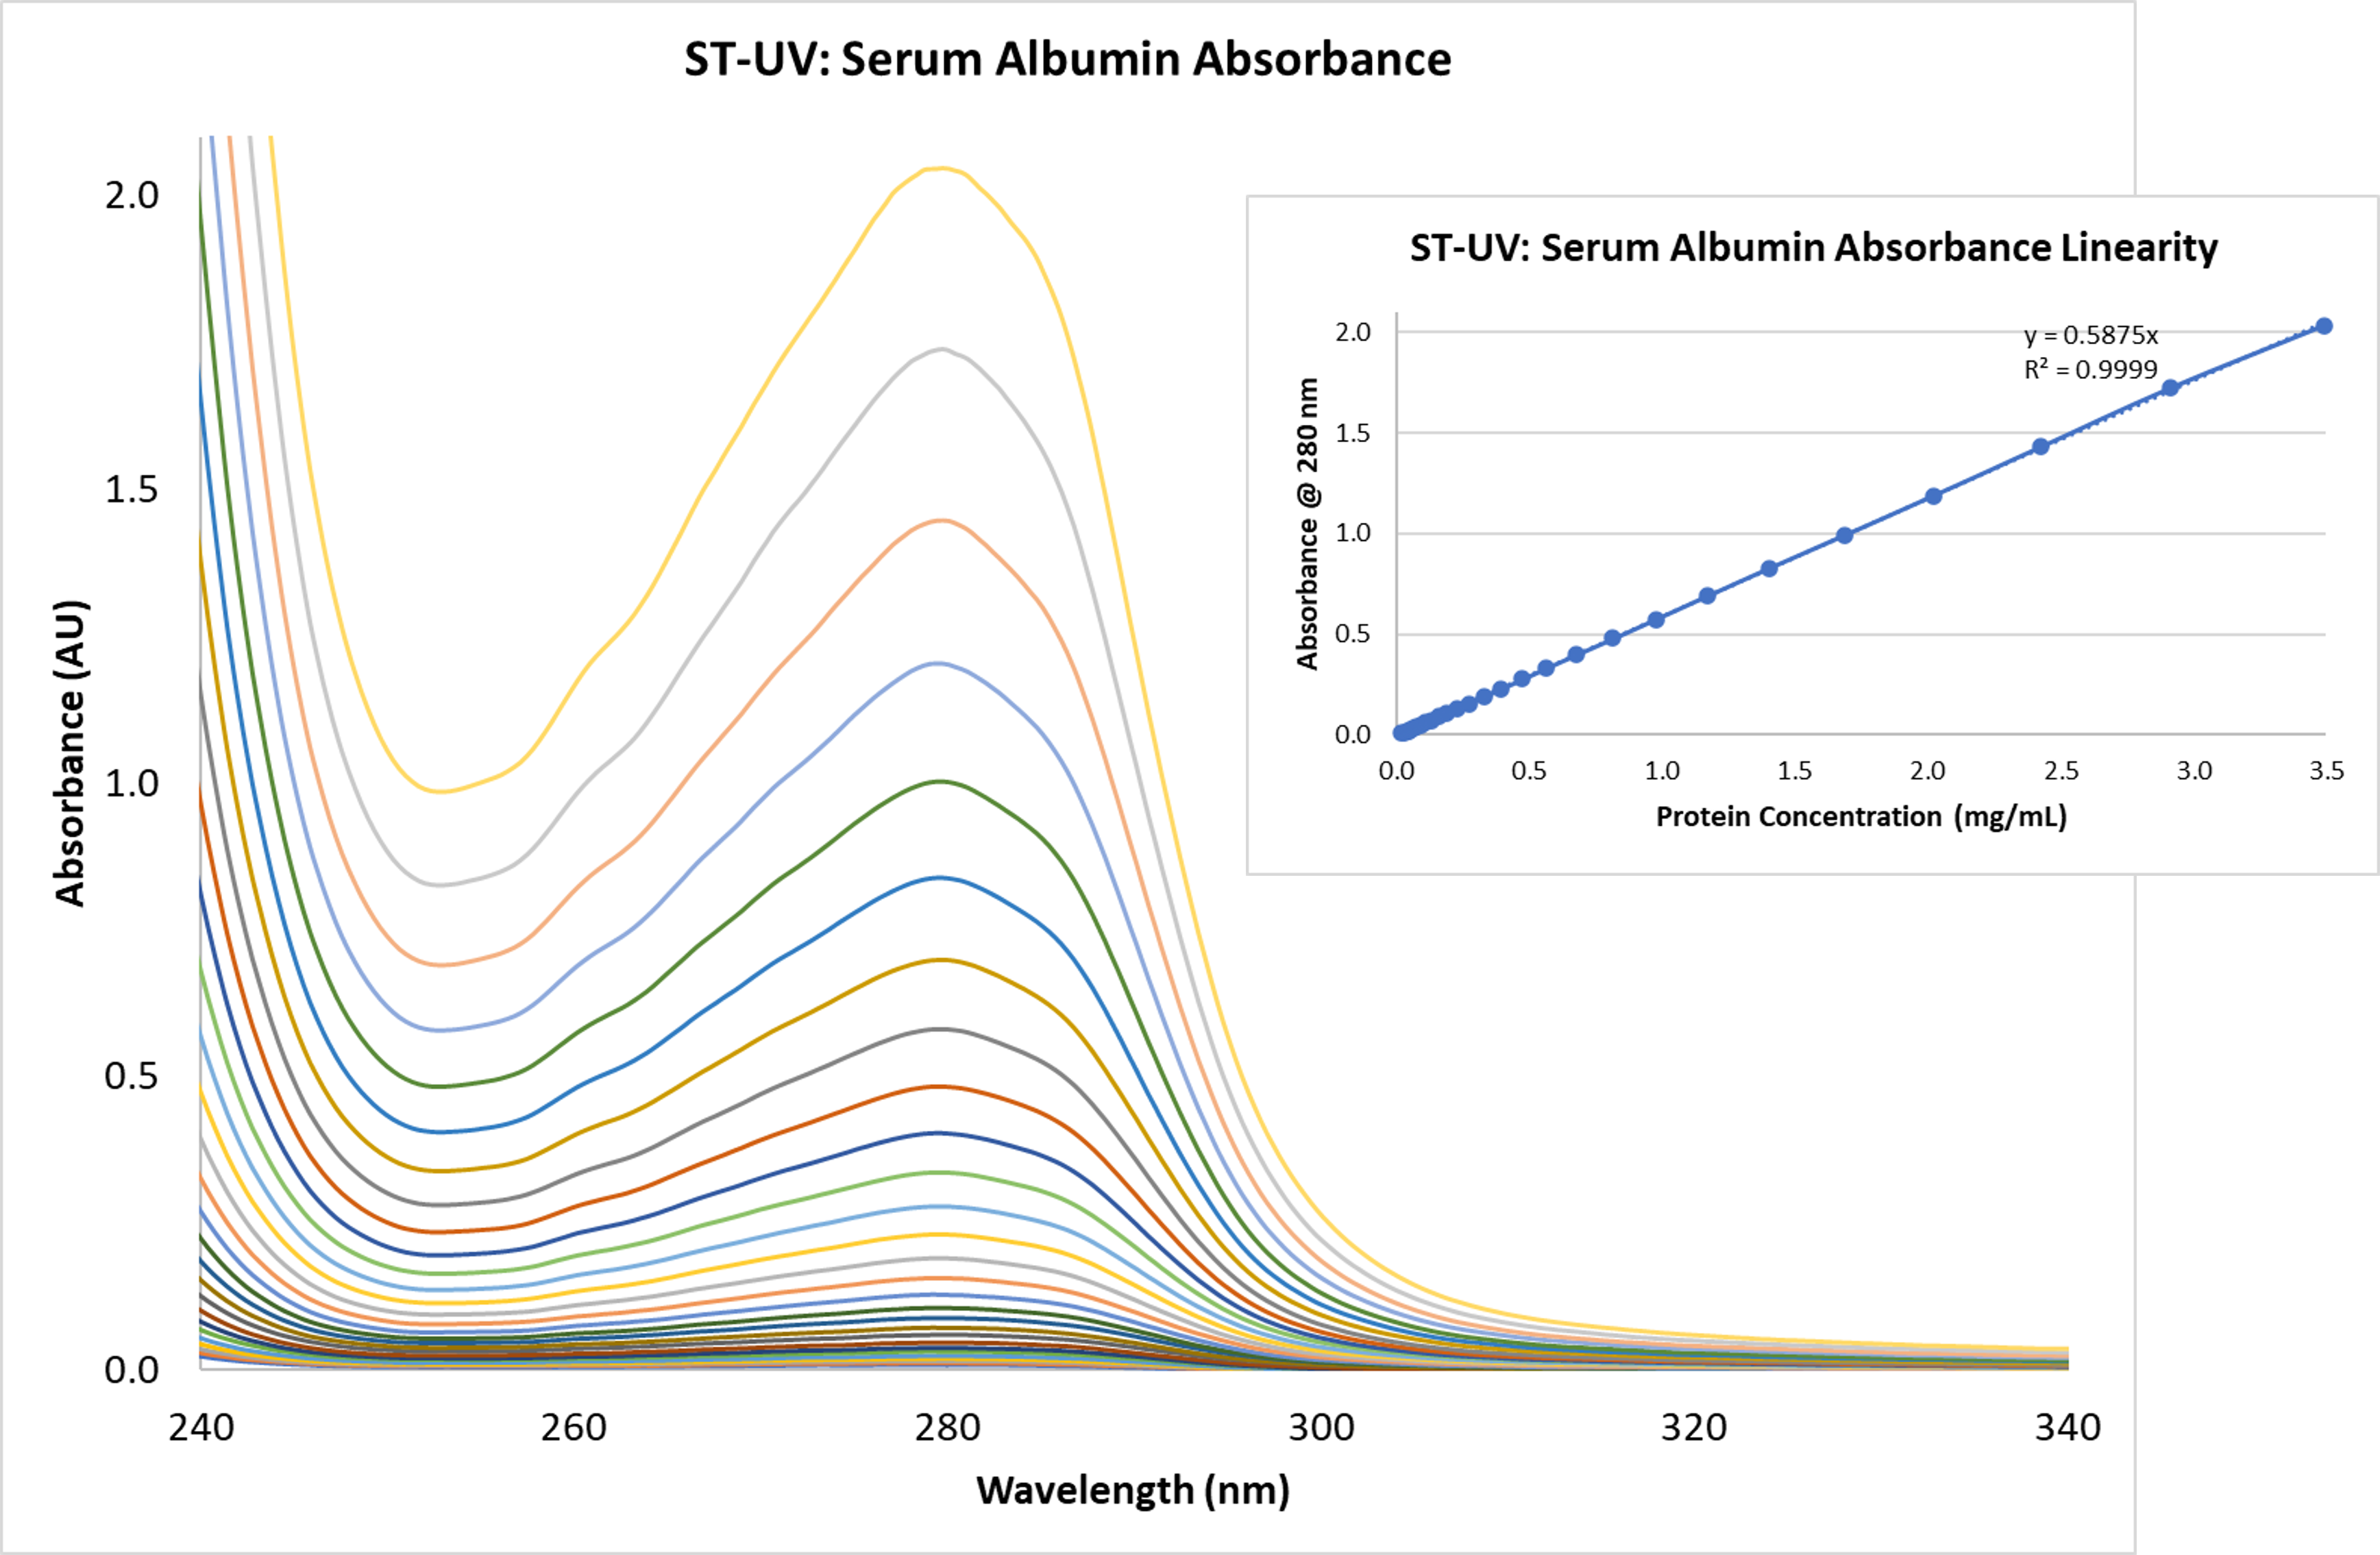
Figure 1. The Ocean ST microspectrometer demonstrates remarkable absorbance linearity over a wide range of protein concentration levels.
Similarly impressive absorbance linearity results were achieved with the Ocean ST measurements of DNA oligo (Figure 2). This suggests the value of Ocean ST for both the users of oligos, which serve as the starting point for a number of molecular biology research and development efforts, and for custom oligo production, where UV-visible spectroscopy is used as a quantification step in manufacturing processes.
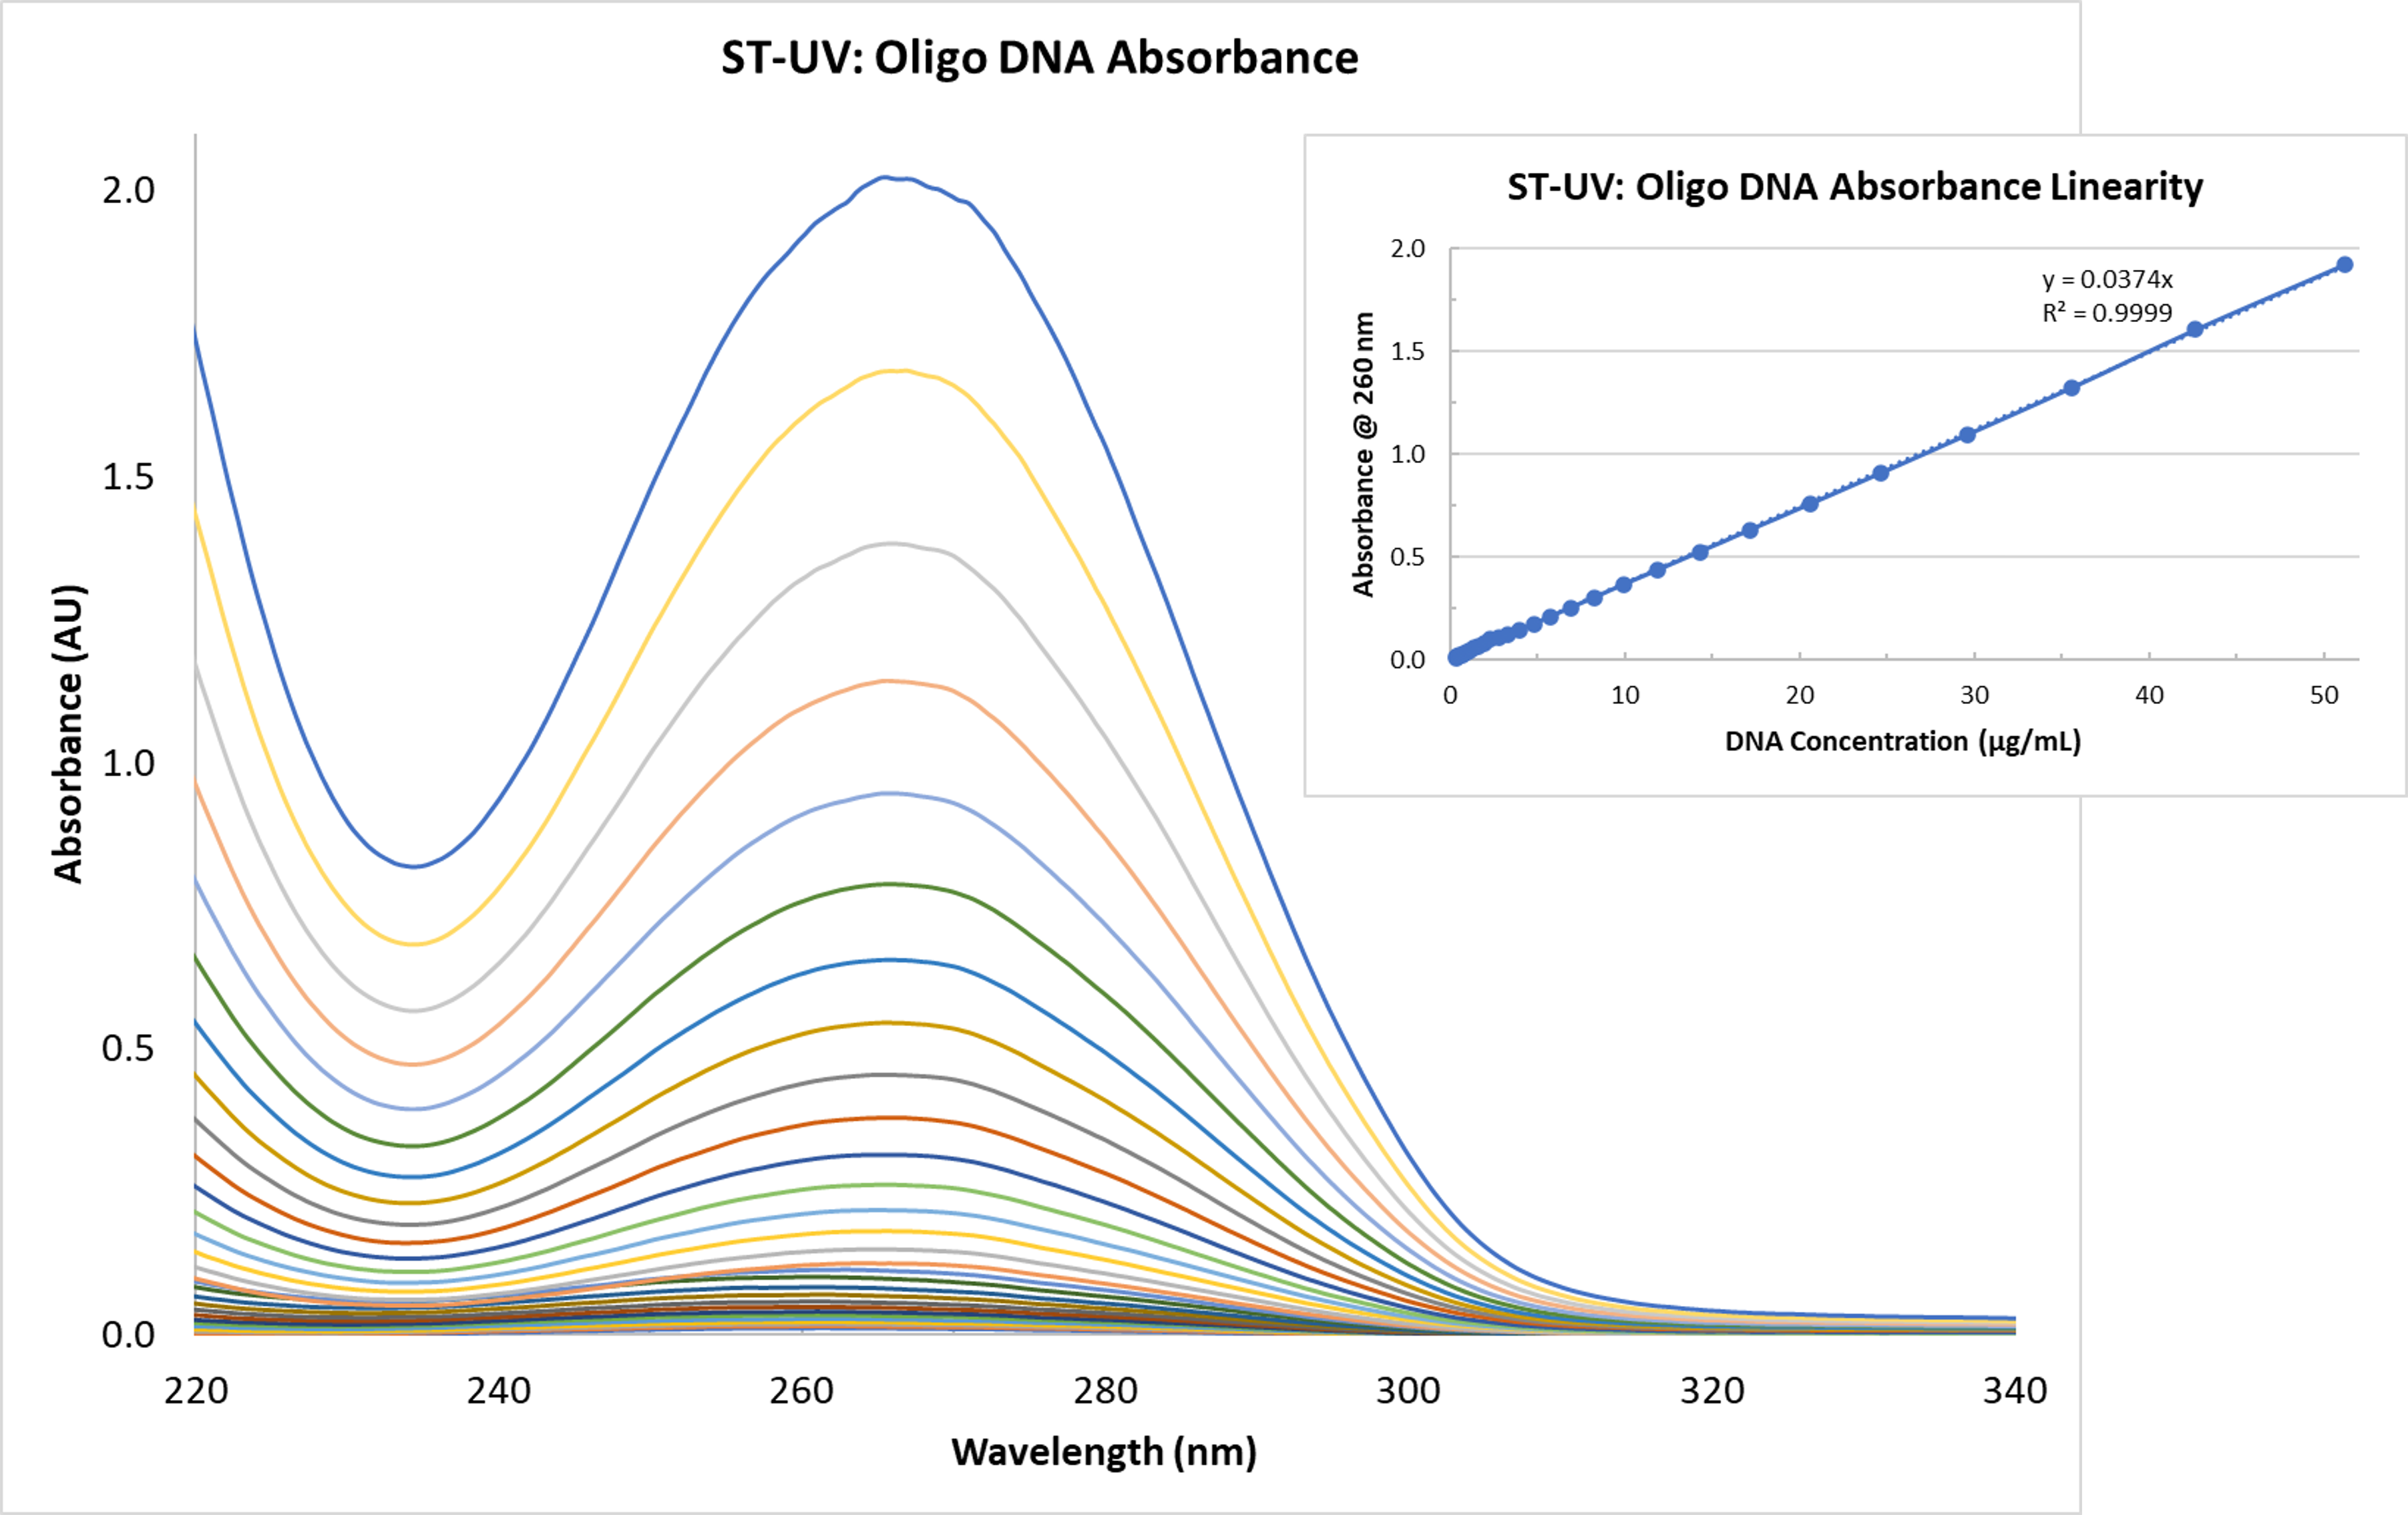
Figure 2. The absorbance linearity demonstrated with the Ocean ST microspectrometer is often associated with more complex, less accessible spectrometers.


